Electromagnetic radiation and matter interaction
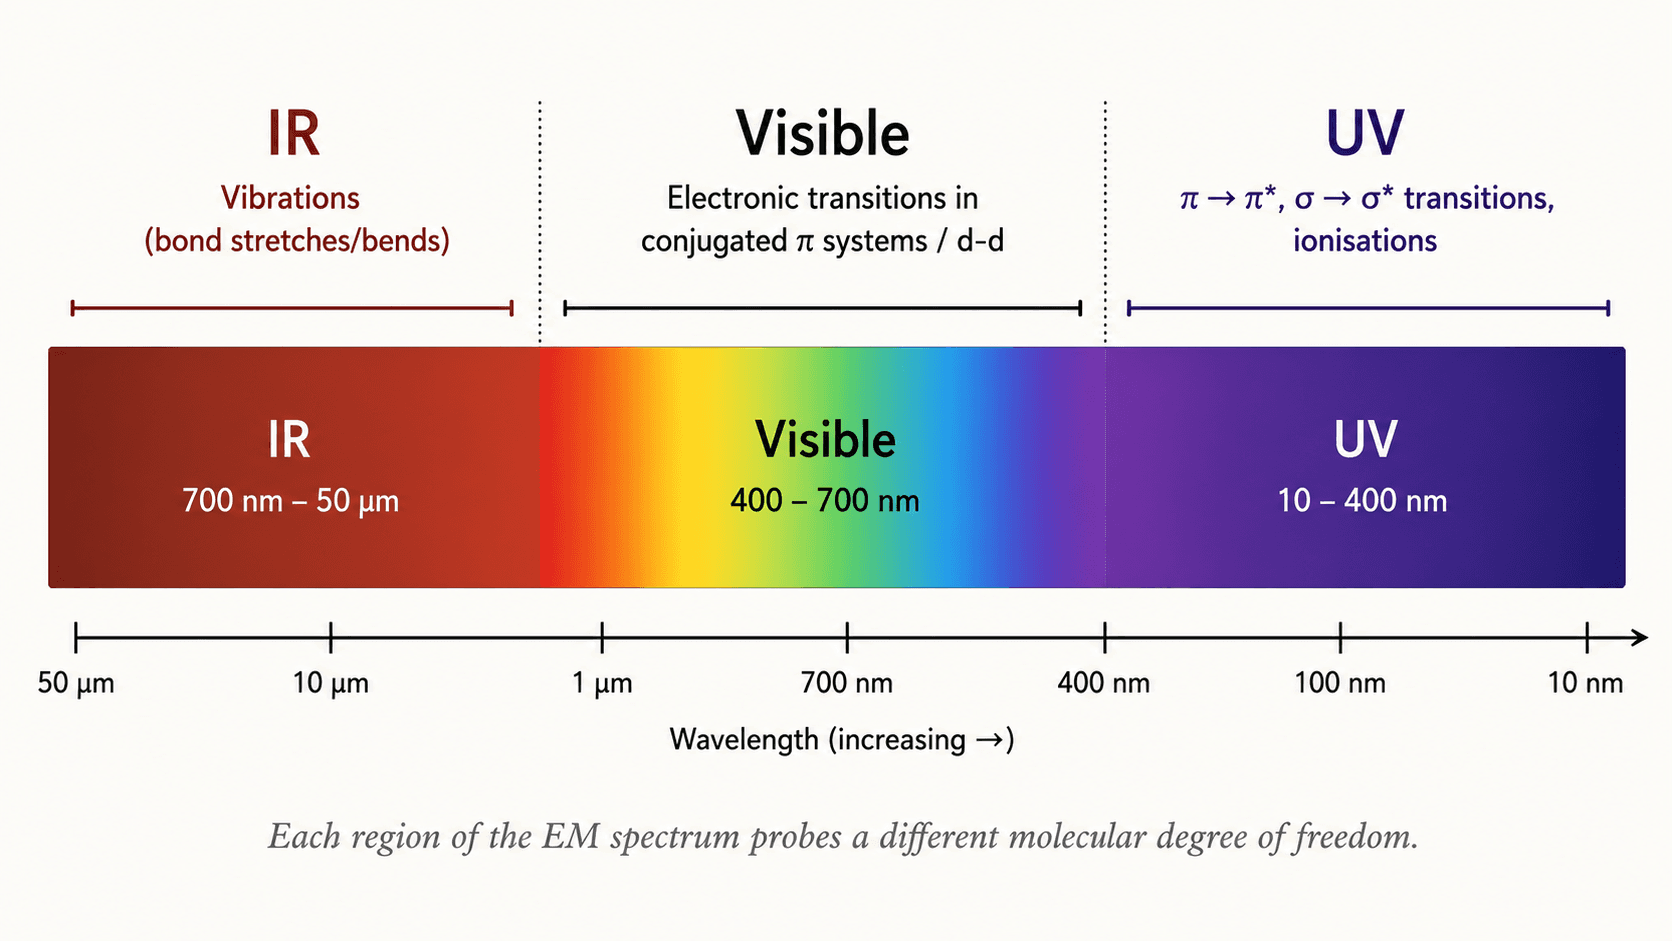
Spectroscopy exploits the interaction between electromagnetic radiation and matter. The energy of a photon is E = h·ν = h·c/λ, where h is Planck's constant (6.626 × 10⁻³⁴ J·s), ν the frequency and λ the wavelength. Different spectral regions probe different energy levels:
- Microwaves (λ ~ cm): molecular rotations.
- Infrared (IR, λ = 2.5–25 μm; ν̃ = 400–4 000 cm⁻¹): molecular vibrations.
- UV-Visible (UV-Vis, λ = 200–800 nm): electronic transitions.
The wavenumber ν̃ = 1/λ (in cm⁻¹) is the practical IR unit because it is proportional to energy. Recall: ν̃ (cm⁻¹) = 10⁷ / λ (nm).
Infrared spectroscopy — vibrational modes
A nonlinear molecule with N atoms has 3N − 6 normal modes of vibration (3N − 5 for a linear molecule). Each mode is a collective vibration at a characteristic frequency. The two main categories are:
- Stretching (elongation): change in bond length. Symmetric (νs) or asymmetric (νas).
- Bending (deformation): change in bond angle — scissors, rocking, wagging, twisting (out-of-plane).
IR selection rule: a mode is IR-active if the vibration produces a change in dipole moment. Centrosymmetric molecules (CO₂ symmetric stretch) give IR-silent but Raman-active modes.
| Bond | Typical ν̃ (cm⁻¹) | Intensity |
|---|---|---|
| O–H (alcohol, free) | 3 580–3 650 | strong, sharp |
| O–H (alcohol, H-bonded) | 3 200–3 550 | strong, broad |
| N–H | 3 300–3 500 | medium |
| C–H sp³ | 2 850–2 960 | medium |
| C≡N, C≡C | 2 100–2 260 | variable |
| C=O (ketone) | 1 700–1 725 | very strong |
| C=O (ester) | 1 735–1 750 | very strong |
| C=C aromatic | 1 450–1 600 | medium |
| C–O | 1 000–1 300 | strong |
The 500–1 500 cm⁻¹ region is called the fingerprint region: modes are heavily coupled and individually hard to assign, but the overall pattern is unique to each molecule.
Reading an IR spectrum
The systematic approach has three steps:
1. Region 4 000–2 500 cm⁻¹: identify X–H stretches (O–H, N–H, C–H). A broad, strong band around 3 300 cm⁻¹ indicates an H-bonded alcohol or amine. 2. Region 2 500–1 500 cm⁻¹: look for triple bonds (~2 100 cm⁻¹) and carbonyls (1 680–1 750 cm⁻¹). The exact C=O position identifies the function: carboxylic acid (~1 710 cm⁻¹), aldehyde (1 720–1 740 cm⁻¹), amide (1 630–1 680 cm⁻¹). 3. Fingerprint region: confirm or rule out a hypothesis by comparing with reference spectra (NIST WebBook, SDBS).
Ethanol, for example, shows: broad O–H (3 200–3 550 cm⁻¹), sp³ C–H (2 870–2 980 cm⁻¹) and strong C–O (1 050 cm⁻¹). The absence of any carbonyl rules out ester or ketone functions.
UV-Visible spectroscopy — electronic transitions
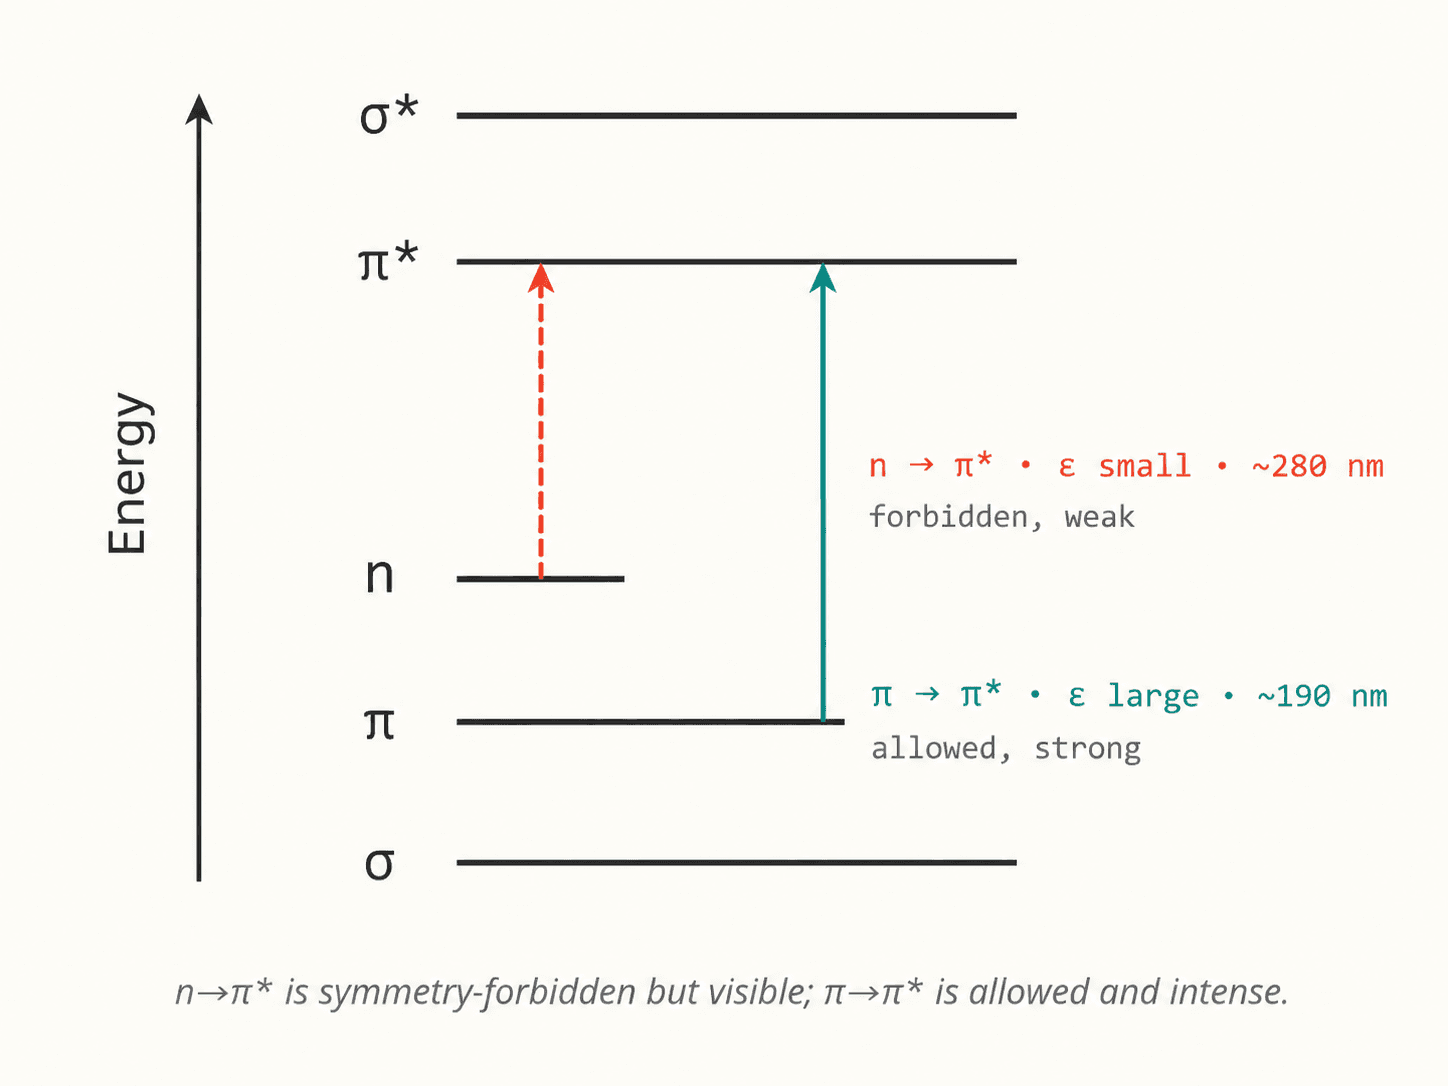
In UV-Vis, the absorbed photon promotes an electron from a filled orbital to a higher-energy empty orbital. The observed transitions are:
- π → π*: conjugated chromophores (dienes, aromatics, α,β-unsaturated carbonyls). λ_max = 200–400 nm; very intense (ε = 10 000–100 000 L·mol⁻¹·cm⁻¹).
- n → π: lone pairs on O, N, S to π. λ_max = 270–380 nm; weak (ε < 1 000 L·mol⁻¹·cm⁻¹).
- n → σ*: less commonly observed in the visible, often < 200 nm (vacuum UV, cut off by air).
Benzene absorbs at λ_max ≈ 254 nm (B-band, π → π) with ε ≈ 200 L·mol⁻¹·cm⁻¹. Adding a conjugated chromophore (nitro, azo group) shifts λ_max to longer wavelengths (bathochromic effect*) and increases ε.
Beer-Lambert law and quantification
The Beer-Lambert law relates absorbance A to concentration c:
A = ε · l · c
where ε is the molar absorption coefficient (L·mol⁻¹·cm⁻¹), l the path length (cm) and c the concentration (mol·L⁻¹). It holds for A ∈ [0.1; 1.0] and ideally dilute solutions.
UV-Vis spectrophotometry is used in enzymatic assays, kinetic monitoring, and pharmaceutical quality control (identity and potency of an active ingredient). Solvent impurities always absorb below their UV cut-off (water: 200 nm; hexane: 200 nm; acetonitrile: 190 nm; DCM: 235 nm).
Combining IR and UV-Vis in practice
The two techniques are complementary: IR identifies functional groups (O–H, C=O, C–N) while UV-Vis probes the conjugated π system. For an unknown natural extract: a strong carbonyl in IR + intense UV absorption at 300 nm point toward a flavone or chalcone. Combined with NMR (next lesson), complete structural assignment becomes possible.